| | Spyview: A 2D and 3D Data Visualization and Analysis Program |
General Information Download Installion Getting Started Automatic axis names MTX files Screenshots Changelog Conversion programs Windows usage tips
Spyview is a data analysis/visualization program that Oliver Dial and myself wrote at MIT for visualizing 2D and 3D datasets. It was originally written for quickly flipping through a large number of STM and AFM files and tweaking the color mapping, but then later evolved to support colorscale plots of arbitrary 2D datasets, and then plotting of 2D crosssections of 3D data sets.
What's with the name "spyview"? The inspiration for spyview is the idea of combining the fancy colormap features of an old windows program called Spyglass Transform with the minimalist user interface of xv (or "xview"), a unix image viewing program. The name is some kind of mix of the two.
2D datasets can be loaded from pgm files (with special headers indicating physical units of the data), from a simple custom binary .MTX file format, from RHK .Stm files, standard resolution .TIF files from Philips XL30S SEM, and from regular ascii text data files. Some other file types, such as the Nanoscope AFM file format, are supported by conversion to pgm files using the applications below.
For ascii text files, the data can be in a "matrix" (ie. matlab-type) format, or can be in a gnuplot "datablock" and "dataindex" format. 3D data is supported through a (simple) custom data file format named ".mtx". See the source and manpages for more info about this 3D format.
Spyview supports many output formats. After image processing, the raw data can be saved to disk in PGM, MTX, or gnuplot or matlab style ASCII data files. The colorized image can be saved to disk as a PPM. Spyview also has a very powerful postscript output setting, which can generate a nice compact postscript file with a plot of your data with automatic X/Y axis titles, a title that can automatically include the filename and data name, a directory stamp, and a colorbar.
With ASCII ".dat" files, spyview can read ranges for x, y, and z dataaxes from a simple text file with the extension ".meta.txt". The file format is very simple: you can find an example here.
You can read more about spyview in this (outdated) unix man page or this help file. You can get the latest version from the links below. I haven't decided about version numbers (for now, I will just keep it at 0.1), but you check the changelog section below for updates. You can check the console messages (run spyview_console.exe in windows) to find out when the version you are running was compiled.
After nearly two years (and two changes of the build machine, a dead motherboard on a server, and the accidental destruction of the CVS archives), a new version of spyview is finally available!
Windows zip file: spyview_windows.zip
I've now set up a github account with the latest verison of the code, including contributions to allow it to compile on a stricter compiler like clang: https://github.com/gsteele13/spyview
The program is free software, and is released under the GNU GPL license.
The lastest version was uploaded on: Mon Aug 26 08:59:50 CEST 2013
Installation in windows is easy: just download the zip file, unzip it, drag your data file on to spyview.exe (or a shortcut to spyview.exe) and that's it!
I have not gotten around to making a universal binary ".app" yet, so you will have to download the code and compile it yourself and also run it from the command line (I haven't gotten around to figuring out how to make file associations in MacOS yet). You will need a working set of build tools and the required libraries. Below is a set of instructions from my student Ben:
Installing Spyview on macOSX Mountain Lion

install xcode
(then in Xcode->Preferences->Downloads get Command Line Tools)
sudo xcode-select -switch /Applications/Xcode.app/Contents/Developer (activate the maker)

install X11
ln -s /opt/X11/include/X11 /usr/local/include/X11  (to fix some links)

install homebrew  with:

ruby -e "$(curl -fsSL https://raw.github.com/mxcl/homebrew/go)"
brew install wget #(not required)
brew install gnuplot
brew install fltk
brew install boost
brew install netpbm
[only if netpbm does not work: brew install -head netpbm ]

(prepare links for spyview installation)
ln -s /usr/local/Cellar/netpbm/10.60.05/include/pm.h  /usr/local/include/pm.h
ln -s /usr/local/Cellar/netpbm/10.60.05/include/pam.h  /usr/local/include/pam.h

installing spyview:
(get the newest version from git.)
./bootstap
./homedir_config
./make
./make install
ln -s  $PWD/spyview/spyview /usr/local/bin/spyview
For linux, it is easiest to download the code and build it yourself. You will need to get the required library development packages, but this should be relatively easy. If you use a debian-based distribution (such as Debian or Ubuntu), you can easily build a debian package using scripts included in the source code.
To start playing with spyview, click on spyview.exe, or run it from the command line with no arguments. This will open the default image.
You can load files using the "Load files" button at the top left. Files can also be loaded by specifiying a list of filenames on the command line. Files can also be added to the file list by dragging and dropping them onto the spyview controls window.
Spyview has a lot of keyboard shortcuts: if you learn them, spyview will become very fast to use. To get a list of the keyboard shortcuts, type "h" into the image window to bring up the help window.
Here is what I recommend for analysing data:
If you are loading your data from a plain ascii ".dat" file, you can have spyview automatically set the axis titles and ranges by including them in a very simple text file.
If you data file is named mydata.dat, have your measurement software create a file mydata.meta.txt. This file contains 12 manditory lines that tell spyview what the X, Y, and Z axis are of your data, and how big they are.
Here is an example of the file format:
# Lines that start with "#" are comments, and are ignored # # The first four lines contain the number of x points (ie. the inner loop, "sweep") # followed by the xmin, the xmax, and the xaxis label. 101 -500.0 400.0 Sweep gate (mV) # The next is the same for y (ie. secondmost inner loop, "loop1") 201 -10.0 10.0 Bias (mV) # The last is for z (outermost loop, "loop2") # If your dataset is only a 2D sweep, you can set these to "1", "0", "1" and "Nothing". 11 0 9 Magnetic Field (T) # Next, you can optionally add labels for each of the colums in the datset. # If you do not give a label, the data will be given a default # data name of "Column X" # For each column label, include one line with the column number, and a second # line giving the column data label 2 Current (pA) 5 Time per pixel (ms) |
Using this information, spyview will automatically load the axis names and ranges of your data set, which can then also be saved in a ".mtx" file after you have done the data processing.
The data in your ".dat" file should be arranged in columns (gnuplot blank lines are not needed since the meta.txt file already specifies the number of x,y and z points). X is defined as the innermost loop, while Y and Z are the two outermost loops.
To enable this, you must select the "DAT with meta.txt" option in "Load options".
MTX is a very simple file format that I created for saving and loading binary data in spyview.
MTX stands for "matrix": an mtx file contains a 3D matrix of data. It can be stored as IA32 "float" or IA32 "double" floating point format (a.k.a. the default floating point format used on Intel processors), directly from an "fwrite()" of the data in memory. It begins with two lines of header, and then the binary data:
Units, Dataset name, xname, xmin, xmax, yname, ymin, ymax, zname, zmin, zmax nx ny nz length [binary data....] |
The first line contains the identifier string "Units", and then the data set axis names and ranges. The second line contains the size of the matrix, and then either 4 or 8, depending on if the data is "float" or "double". After that, the file contains the binary data.
Here is a simple script for loading an MTX file into matlab:
function M = loadmtx(name) fp = fopen(name); fgets(fp); s = sscanf(fgets(fp), '%d %d %d %d'); if (s(4) == 4) M = fread(fp, s(1)*s(2)*s(3), 'float'); M = reshape(M,s(3),s(2),s(1)); else M = fread(fp, s(1)*s(2)*s(3), 'double'); M = reshape(M,s(3),s(2),s(1)); end |
and one for saving MTXs from matlab:
% savemtx by Samir Etaki
%
% saves matrix M to a double precision floating point mtx
% file which can be read by the program 'spyview'
% syntax: savemtx(name,M), where name is the full file path
%
function savemtx(name,M)
s=size(M);
fp = fopen(name,'w');
if     (length(s)==3)
    fprintf(fp, '%d %d %d 8\n', s(3), s(2), s(1));
    fwrite(fp, reshape(M,s(3)*s(2)*s(1),1), 'double');
elseif (length(s)==2)
    fprintf(fp, '%d %d %d 8\n', s(2), s(1),1);
    fwrite(fp, reshape(M,s(2)*s(1),1), 'double');
elseif (length(s)==1)
    fprintf(fp, '%d %d %d 8\n', s(1),1,1);
    fwrite(fp, M, 'double');
end
fclose(fp);
|
These scripts ignores the units metadata. It should also be reasonably simple to read these in and then generate X, Y, and Z matrices using grid_data() in matlab (I may include such a script here in the future...).
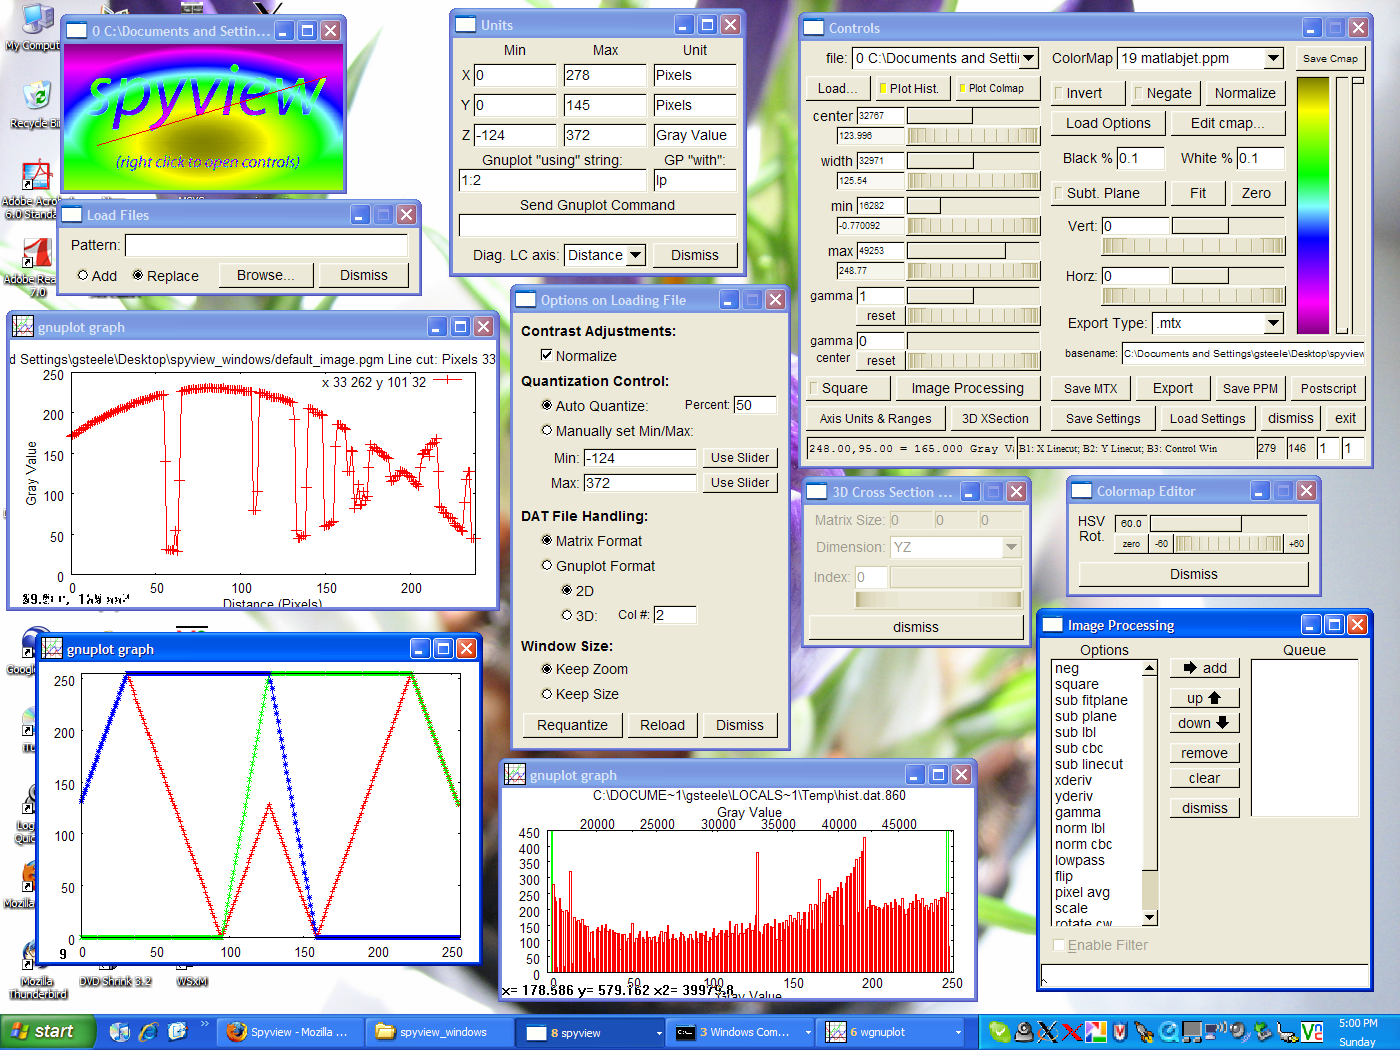 A
screenshot showing spyview running under windows with nearly all the
subwindows open.
A
screenshot showing spyview running under windows with nearly all the
subwindows open.
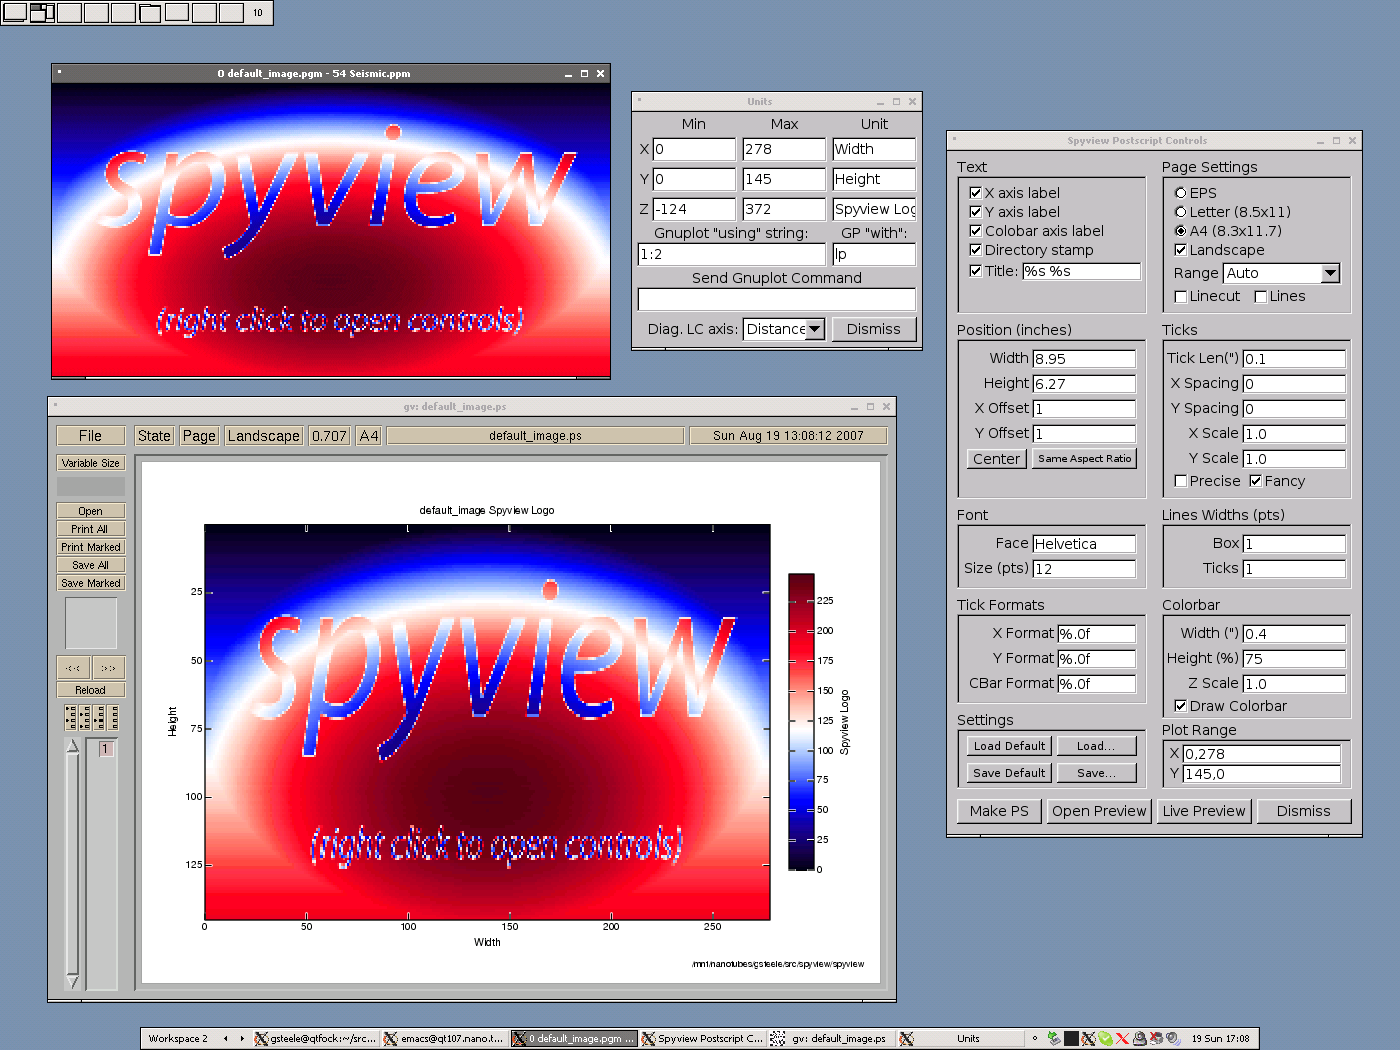 A
screenshot showing the spyview postscript control panel, along with
the postscript output in a ghostview window (unix version displayed on a
windows machine (which is running bblean) over an
xwindows connection).
A
screenshot showing the spyview postscript control panel, along with
the postscript output in a ghostview window (unix version displayed on a
windows machine (which is running bblean) over an
xwindows connection).
Some spyview images that made the cover:

If you have one to include, send me an email if you want to put it up here... :)
26-Aug-2013 Changed postscript output so that it outputs a file $mydata.print.set (instead of $mydata.set) in order to avoid overwriting the default file for instrument settings in the python QT lab library. Also changed the saving of the printer settings file to $mydata.print.svs so that it does not overwrite the new default .svs files from the "ctrl"-click save and load settings option.
23-Aug-2013 Added a keystroke ('m') to permute the order of the mouse buttons (very useful for using spyview on laptops like the macbook that do not have 3 mouse buttons...). Also added and image processing option to swap the axis endpoints to get around some python meta.txt bugs, and set some better automatic values on the vi_to_iv routine. Also added a y=b^data, and an option to load print settings from current directory by holding "shift" and clicking on "Load..." or "Save...". This is handy since spyview generates a printer settings file with current settings in current directory every time you make a postscript file. Also added the same "shift" option for spyview general settings. For settings files, I also added an option to load/save $(basename).svs by "ctrl"-clicking on "Load Settings" or "Save settings".
31-Jul-2013 Added a cool new VI-to-IV converter to remap 2D VI curves of superconducting junctions onto IV curves.
18-Oct-2011 Undid the earlier fixes for Vincent's meta.txt files: it turns out his files were broken, not the spyview meta.txt code.
18-Aug-2011 Added keystrokes [ and ] for de- and in-creasing the gamma without opening the controls window. Also added current cursor position and datavalue to the title bar: the format of the coordinates can be controlled with the format specifier in the cursor position window, and is now saved in the settings file.
3-Aug-2011 Added a filter to remove DMM overloads from a dataset
1-Aug-2011 Change code so that the first two "pulse generator" labels in the labview drop down boxes are replaced with RF2 Freq and Power.
27-Jul-2011 Fixed a bug that was preventing the image processing filters from being added to the dataname when using meta.txt files.
20-Jul-2011 Added an "autoflip" option, which will flip the image so that the more negative x (y) range is on the left (bottom) of the image. Also added a configurable number of bins for hist2d.
19-Jul-2011 Added a new "2D Histogram" feature to spyview. For each column of your dataset, it converts the y axis into a histogram of the datavalues in that column (useful for analysis of superconducting junction data).
19-Jul-2011 Fixed loading of .dat files with meta.txt data: I don't use these, but apparently the users who do haven't been submitting any bug reports...The data was being loaded in the wrong order into the matrix. Also flipped the y-data so that it appears with teh usual orientation for a conventional (neg to pos) sweep.
29-Mar-2011 Build system finally running again after TU Deflt disconnected my build computer. Fixed an error in the sign of the yderivative, and replaced the default settings file in the .zip file so that we (hopefully) don't have the "serialization error".
10-Aug-2010 xderiv and yderiv now scale properly based on the axis ranges, so the data should really be the derivative. also: for some time now, spyview in windows uses the settings files in the directory where spyview is run from (no longer neccessary to run the "copy_def_settings.bat" scripts).
5-Aug-2010 Some updates to spypal (the spyview palette editor) that make it now reasonably user friendly. Added a gnuplot script output for peak finder that allows you to plot the peak positions in gnuplot overlaid with the dataset.
29-Mar-2010 Major bug fix: meta.txt files should no longer segfault if the datafile is incomplete. Also some fixes for crashes with gnuplot 3D files.
13-Feb-2010 Axis ranges are now put into the window title (handy for screenshots into powerpoint).
12-Feb-2010 Keystroke "d" now tries to load the default colors and image processing settings for the currently loaded file. Also, improved handling of loading incomplete gnuplot-style 3d datasets (will fill the remaining 3d matrix with the last reading).
3-Feb-2010 Bugfix with sorting of image operations (the Fl_Browser->swap() routine doesn't seem to work properly under win32, so I wrote my own...). Also added the build stamp at the end of the text in the help window.
29-Jan-2010 List of image operations is now sorted alphabetically.
28-Jan-2010 Another yflip bug..this time in dat2mtx with splitting.
27-Jan-2010 Hopefully fixed some segfault problems with interp. Also added save/load settings files for image processing.
25-Jan-2010 Updated LineDraw mode: save/load lines, list of slopes and intercepts of current lines.
21-Jan-2010 Renamed "gamma" image processing to "power" (for power law), and added a nice epsilon option for negative powers. Also changed it so that non-integer powers of negative numbers (like sqrt(-1)) are set to zero (instead of NaN). Fixed a bug with the "automatic directory changing".
18-Jan-2010 Added the ability to save and load the exact color settings displayed in the file: histogram limits, quantization limits, gamma settings, and the colormap.
18-Jan-2010 "Fix colors" should now work. Also, spyview now changes directory to the directory where the file whenever a file is loaded, and only filename, not full path, is put in postscript title.
17-Jan-2010 Found one more "flip y min/max" bug, this time in the saveMTX routine.
6-Jan-2010 I think I have finally properly solved the problems with flipped axes ranges in both 2D and 3D files. Also tuned the focus eating a bit so that it is less intrusive, along with some fixes for the mingw32 gcc-4.2.1 cross compiler.
18-Dec-09 More bug fixes with the vertical ranges, in particular with 3d files and YZ/ZX cuts. Also, fixed a bug causing crashed with peak finder outlier support.
16-Dec-09 Fixed a bug with dat2mtx and the vertical ranges.
14-Dec-09 Added some buttons to make it easy to keep mapping of data values to colors fixed. Also added regridding and scaling image processing functions based on bilinear interpolation.
9-Dec-09 Bugfix for dat2mtx (segfault if no -x option given). Added outlier rejection to the peak finder code, as well as some other peak finder goodies.
4-Dec-09 Many updates:
2-Nov-09 Added "engineering" and "scientific" options for the tic marks. Bounding box update: it will always be a bit wide for now, since we have to estimate it before we draw everything.
1-Nov-09 Fixed code so that ghostscript can properly make use of the bounding box for EPS, essentially writing a workaround for this four year old ghostscript bug: http://bugs.ghostscript.com/show_bug.cgi?id=687915.
28-Oct-09 Fixed matlab export code to remove non-alphanumeric characters from the .m file names. Also, you can now take vertical line cuts using "ALT" and the right mouse button in case you are stuck with a two button mouse.
14-Oct-09 Fixed some bugs related to .dat files. meta.txt files should also now load even if they are truncated. Also wrote even more code to deal with buggy versions of the labview program!!!!
27-Sep-09 Delft txt update: will now include var2 in the axis labels if not "nothing". Hopefully, will soon just update the labview so that it uses meta.txt files.
20-Sep-09 Update to postscript numbering UI
17-Sep-09 Fixed bug in Delft legacy file format code.
9-Sep-09 Added keystroke shortcut for adding a "negate" data operation to the image processing queue.
7-Sep-09 Fixed "nearest line" update window update in LineDraw mode. Also added Oliver's "SPYPAL" gui for generating your own colormaps (help in win32 not working yet...)
18-July-09 Added export to matlab .m file. The file contains the current colormap, the current dataset, and generates both an imagesc plot and a gouraud cam-lit surf plot with the currently chosen colormap range.
14-June-09 Added "negative" options for crop (ie. -5 is "5 pixels from the right"), and also a "remove lines" function. Rewrote outlier rejection on "sub lbl" and "sub cbc" to include rejection of points based on their value as well as their pecentile ranking. This works pretty well now for flattening images. Also removed page size operator from EPS output: this should fix the conversion of EPS files to PNG and PDF.
13-June-09 Added an option to horizonally shift the dataset after a given row.
12-June-09 Added new output from PeakFinder that includes peak spacings and data values, and also separates peaks in different rows by gnuplot indices. Probably some other bug fixes as well.
22-May-09 Added new GUI for generating PDF and PNG files. CMYK PDF is supported through the ghostscript /DeviceCMYK option, and location of ghostscript and ghostview can be chosen with a browser. The preview/formats settings are also now saved in a separate settings file, independent of the spyview settins or the image printer settings.
18-May-09 Fixed drag and drop bug where last file was not getting loaded.
16-May-09 Added support for multiple file drag-n-drop. Also added a batch script for updating to the latest version of spyview without downloading a new zip file (note all copies of spyview must be closed).
14-May-09 Added support for dragging files directly into the image window.
13-May-09Added option for putting DAC values in data name from Delft .txt file. Also added a batch scripts for generating PDFs and PNGs (with transparency) under windows (location of gswin32c.exe is hard coded in .bat file: change it if your location differs...). The latest file is now selected when adding with 5Hdrag-and-drop (your welcome, Sergey...)
25-Apr-09Fixed huettel2mtx. Command line programs now run in console mode in win32.
23-Apr-09 Added a pretty sweet "switch removal" algorithm. Also fixed labels in crop settings, made the ImageWindow resizable under windows. Also uploaded a new version of gnuplot, which doesn't open the extra "wgnuplot" window. However, if you use the non-console version of spyview, you'll still get the cmd.exe window. I haven't figured out a way around that one yet.
11-Apr-09 Added support for .meta.txt files, probably some other features as well.
25-Feb-09 Added cmd line program for converting Toeno's data+header files into an MTX with nice headers.
15-Feb-09 Added cmd line program for converting legacy delft files to mtx, with better metadata parsing.
30-Jan-09 Added odd/even row option, tweaked legacy deflt support.
17-Jan-09 Enhancements of "LineDraw" mode: include nearest line highlighting, a gui for displaying the properties of nearest line, modified nearest line calculation to include perpendicular distance.
13-Jan-09 Improved support for old Delft legacy files, some other changes by Oliver.
10-Oct-08 Added drag & drop support: drag files onto the controls window, and they will be added to the file list.
3-Oct-08 Added native support for FEI XL30S TIF tif images (normal resolution only).
1-Oct-08 Added fiddle plugin (Ctrl-F to enable/disable)
19-Sep-08 Fixed loop1 endpoints on delft txt files.
31-Aug-08 Added a commandline program dat2mtx, modified spybrows to be windows-user friendly.
28-Aug-08 Added support for color bars in the postscript output that have a linear color gradient with non-linear tic value spacing, useful for making human readable colorbars when using small gamma values.
27-Aug-08 Added linecut fitting code from Oliver. Also fixed some bugs that were causing win32 segfaults.
31-Jul-08 Added a fancy peak detection routine!!!
23-Jul-08 Added "save zoom window contents at MTX" option (keystroke Ctrl-z), added option for turning off auto xranging on linecuts, added information in cursor window about position of zoom window.
22-Jul-08 Added a crop function. Oliver added some nice code to throttle the output to gnuplot so that it doesn't get so swamped when dragging a line cut. Fixed some bugs.
17-Jul-08 Compiled win32 version against an FLTK build with USE_COLORMAP disabled: this will solve color dithering problems when running over remote desktop.
11-Jul-08 fixed some bugs, fixed sub_linecut
7-Jul-08 Fixed bug in log function, fixed file selector menu for filenames with slashes in them, other bugfixes.
2-Jul-08 Lots of changes, including directional derivative, fixed a bad memory leak, added help window (keystroke "h"), more bug fixes.
2-May-08 Removed debian package from webpage (recommend building from source using "debian/rules binary"). Added nice PDF output from Oliver (note: requires gs binary in your path).
24-Apr-08 Added automatic offset subtraction to log function, as well as fix for gnuplot-win 4.2.3 cursor position display bug.
22-Apr-08 Added SPYVIEW_PREF_DIR environment variable in win32
3-Mar-08 Added a new "Cursor position" window and progress dialog box for loading ascii data files.
13-Feb-08 Some new features:
8-Feb-08 Fixed loading of gnuplot "index" files, added some default settings files for data sets with one loop, two loops, and for the delft legacy format.
6-Feb-08 Fixed y axis flipping on the postscript output, and some other small changes
30-Jan-08 Updated source package to fix a bug that was causing errors with newer versions of gcc.
18-Sep-07 Spyview will now display the default image instead of exiting if a file has an error.
23-Aug-07 Added support for delft legacy .dat format. Added loads more colormaps to the default install, which are now sorted by subdirectory in the drop down box.
All of these are released under the GPL.
ns2pgm: a program which converts nanoscope AFM files into a set of PGM files for use with spyview. Avaible as a Debian linux 4.0 binary ns2pgm, as a windows command line program ns2pgm.exe, or as source code ns2pgm.c. In windows, you can drag and drop files onto ns2pgm.exe, or run it from the command line. I have tested this with files from version 5.12 of the nanoscope software.
tif2pgm.sh OBSOLETE! Spyview now natively supports XL30S standard resolution TIF files. tif2pgm.sh is simple shell script to convert a standard resolution TIF file from a Philips XL30S SEM to a pgm file for spyview. It uses the magnification information stored in TIF header so that line cuts in spyview show distances in microns. Should run under cygwin, but you will need to have "gawk" and "netpbm" installed, and this little program tcut (windows version tcut.exe, source tcut.c).
Spyview for windows is designed to run standalone, without any intallation needed. Just unzip the file and you can click on spyview, or drag and drop files onto the .exe file.
Spyview stores settings and preferences information in a directory "spyview" in "Application Data" in your "Documents and Settings" directory. You can copy a bunch of default configurations from the zip file by clicking on "copy_def_settings.bat".
In the settings directory, you can also make a directory "cmaps" where you can put custom colormap files. You can also make your own colormaps by creating a PPM file that is exacty one pixel wide (of any length), using a program such as "The GIMP", and saving the PPM file in the "cmaps" directory. Note this makes it very easy to use other peoples colormaps since all you need to do is take a screen dump and the crop out the colormap pixels!
You can also create file associations so that you can click on spyview compatible files (.pgm,.dat,.mtx,.Stm) in windows explorer and they will open in spyview. Do this by right cliking on a .pgm (or etc) file and selecting "Open with...". Click on "Browse...", select "spyview.exe" from the directory where you unzipped the zip file, and then click on "Always use the selected program to open this kind of file". If this doesn't work, you can click on the "make_associations.bat" batch file in the spyview zip file, which will add a spyview file type for .pgm and .mtx files.
Note: the spyview UI was designed for unix, in particular it is much easier to use if you have a "Focus follows mouse" setting in your window manager (which means that you do no have to click on a window to give it the focus: it will get the mouse and keyboard focus when you hover your mouse over it). You can get this in windows by installing the True XMouse software.
If you want to use spyview from the windows command line, you should define an environment variable "SPYVIEW_DIR" which points to the directory where the spyview executable is stored so that spyview can find the colormaps and the default image.
If you want to be able to preview postscript files using the button in the postscript control panel, you should install the "gv" program from cygwin, and make sure that the cygwin bin directories are in your windows PATH variable (configured in "Control Panel\System\Advanced\Environment Variables").
Note: under windows, when you open a plot (such as a cross section, or when you plot the histogram or colormap) a windows command window will pop up as well as the gnuplot window. This is annoying, but unavoidable since I communicate with gnuplot over a pipe. You can just minimize the command window.
Tip: You can change the size of the default gnuplot window by clicking on the icon on the top left of the window title bar and selecting "Options\Update (...)", which will set the windows gnuplot default window size for your windows profile.